What are the Time-Temperature Tunnel Fire Curves
Source: aestuver.com
In tunnel fire safety engineering, understanding the impact of fires on tunnel structures is crucial, and this is achieved through the use of time-temperature curves.
These curves are instrumental in simulating how materials behave when exposed to fire over time, forming the foundation for establishing safety requirements in tunnel construction. These requirements encompass the design and application of fire-protection cladding, in tunnels as well as the formulation of effective evacuation and rescue strategies in the event of a fire. The primary objective of these specifications is to ensure that tunnel structures can withstand high temperatures during a fire, thereby preserving their integrity and preventing catastrophic failure.
To ensure that a tunnel structure remains functional during and after a fire, several critical temperature limitations are established. These include:
- Restricting the maximum temperature on the concrete surface: This is vital to prevent the surface from deteriorating under intense heat.
- Restricting the maximum temperature on the reinforcing steel: This ensures that the steel maintains its strength and does not contribute to structural failure.
The concrete structure’s ability to bear loads during a fire hinges on these temperature criteria, which are defined either by national standards or tailored to specific projects. Adherence to these requirements is critical and is typically validated through extensive fire testing before construction begins. For example, fire protection measures, such as the use of Aestuver® fire-protection boards, are preemptively tested to document their effectiveness in real fire scenarios.
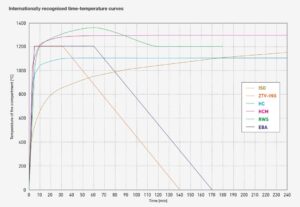
Globally recognized time-temperature curves play a pivotal role in this process, each offering different insights into fire behavior, including how quickly a fire reaches peak temperature and how long these extreme temperatures persist.
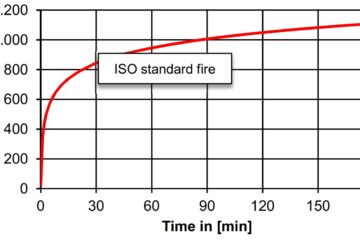
ISO Curve

Source: https://www.heissbemessung.net/
The ISO 834 curve, often referred to as the standard fire temperature curve or cellulosic fire curve, is a baseline thermal stress model used extensively in the construction industry. It represents the minimum level of stress expected from an interior building fire, omitting the detailed phases of ignition, smoldering, and cooling. Despite its simplicity, the ISO curve is a fundamental tool for analyzing fire exposure in building components.
You can read more about the ISO Curve here.
ZTV-ING Curve / RABT Curve

Source: https://www.heissbemessung.net/
In Germany, road tunnels are designed according to the ZTV-ING curve, irrespective of their design or traffic type. The ZTV-ING curve emphasizes that the tunnel’s reinforcing steel must not exceed 300°C, ensuring the structural framework remains intact during a fire. Furthermore, only materials classified as A in accordance with DIN 4102 or equivalent are permitted, ensuring they do not emit harmful substances during combustion.
EBA Curve (EUREKA)

For railroad tunnels, the design must incorporate self-supporting structures that meet the highest standards of safety and intended use.
The EUREKA fire curve, also known as the EBA fire curve or EUREKA EN 499, is a specific fire design curve used primarily for evaluating the fire resistance of railroad tunnels. Developed as part of the European EUREKA research project, this curve represents a severe fire scenario to ensure that tunnel designs can withstand high-intensity fires.
The EUREKA fire curve is used to model extreme fire conditions in railroad tunnels. It helps in designing tunnel structures that can handle high temperatures and intense fire scenarios, ensuring the safety of passengers and facilitating effective firefighting operations.
Temperature Profile:
- Initial Temperature Rise: The EUREKA fire curve simulates a fire reaching a temperature of approximately 1200°C (2192°F) within 5 minutes of ignition.
- Duration: The curve models how temperatures evolve over time, representing severe fire conditions that escalate quickly and maintain high temperatures for a critical period.
Application:
- Railroad Tunnels: It is specifically tailored for railroad tunnels, where the risk of intense fires, such as those caused by passenger trains or heavy rail traffic, is significant.
- Design and Safety: The curve is used to assess and ensure the structural fire resistance of tunnel components, including concrete, steel, and other materials, under extreme fire conditions.
Comparison with Other Curves:
- ISO 834 Curve: The ISO 834 curve represents a more general fire scenario with lower temperatures and slower escalation. In contrast, the EUREKA fire curve models a more severe and rapid fire scenario.
- Hydrocarbon Curve (HC): While the hydrocarbon curve represents fires involving fuels like gasoline or diesel, the EUREKA fire curve provides a more specific profile for railroad tunnels, focusing on high-intensity fires.
Design Considerations:
- Structural Fire Protection: The EUREKA curve informs the design of robust fire protection systems, including fire-resistant cladding and cooling systems, to ensure that tunnel structures can endure extreme heat and prevent collapse.
- Emergency Response: It also aids in planning for emergency evacuation and firefighting efforts by simulating high-temperature scenarios that may impact response strategies.
The EUREKA fire curve, or EBA fire curve, is a critical tool for designing and evaluating the fire resistance of railroad tunnels. By modeling severe fire conditions with high temperatures and rapid escalation, the EUREKA curve helps ensure that tunnel structures are resilient to intense fires, thereby enhancing safety and operational effectiveness in case of fire incidents.
Hydrocarbon Curve (HC)

Source: https://www.tls-containers.com/
Originating in the 1970s, the hydrocarbon curve was initially developed to model fires in industrial and offshore settings, particularly hydrocarbon-fueled blazes. However, it has since been adapted for tunnels due to their higher fire loads. This curve is particularly relevant for fires that mimic the conditions of gasoline or diesel pool fires, though it is also applicable to solid material fires.
Modified Hydrocarbon Curve (HCM)
The HCM curve is designed to reflect extreme fire conditions, particularly those involving large quantities of flammable materials, such as hydrocarbons. It is used to ensure that structures, especially tunnels, can withstand very high temperatures for prolonged periods.
Temperature Profile:
The HCM curve reaches a maximum temperature of approximately 1300°C (2372°F). This is higher than the standard Hydrocarbon Curve, which typically peaks at around 1100°C (2012°F).
The curve models a fire scenario where this maximum temperature is sustained for a longer duration, usually reflecting severe and prolonged fire conditions.
Application:
The HCM curve is employed in the design and safety assessment of critical infrastructure like road and rail tunnels, where the risk of intense fires is significant.
It helps engineers design fire protection systems and structural elements that can endure extreme fire scenarios, ensuring the safety of both the structure and its users.
Comparison with Other Curves:
Hydrocarbon Curve (HC): The HC curve represents typical fire scenarios involving hydrocarbon fuels, with a maximum temperature of about 1100°C. The HCM curve, with its higher temperature and longer duration, offers a more severe and realistic simulation for high-risk environments.
ISO 834 Curve: The ISO 834 curve provides a more general fire scenario with lower maximum temperatures and shorter durations. The HCM curve is used for more extreme fire conditions and is therefore more demanding in terms of structural fire resistance.
Design Considerations:
Using the HCM curve in design ensures that safety measures are robust enough to handle severe fire conditions. This includes fire-resistant materials, enhanced structural protection, and effective fire suppression systems.
The Modified Hydrocarbon Curve (HCM) is a critical tool for designing infrastructure that can withstand severe and prolonged fire scenarios. By simulating extreme conditions with high temperatures and extended durations, the HCM curve helps ensure that tunnels and other critical structures are adequately protected against intense fires, thereby enhancing overall safety and resilience.
Rijkswaterstaat Curve (RWS)

Source: https://commons.wikimedia.org/wiki/File:Rws_tunnel_curve.jpg
Key Features of the RWS Tunnel Fire Curve
Purpose: The RWS fire curve is designed to simulate severe fire conditions that road tunnels might experience, especially those involving large-scale fires, such as tanker fires.
Temperature Profile:
The RWS curve models a fire scenario where a tanker carrying 45,000 liters of gasoline is involved.
Under this curve, the fire temperature reaches maximum of 1350°C (2462°F) within 60 minutes. After 2 hours the temperature drops to 1200°C (2192°F). In its modified version, this temperature is maintained for an additional hour, making the total duration of high temperature exposure 3 hours.
Some special tunnel designs require RWS fire curve to be maintained even for 4 hours.
Application:
The RWS curve is used to assess the fire resistance of tunnel structures to ensure they can endure extended periods of intense heat. This is crucial for preventing structural failure during large-scale fires.
It helps in designing fire protection systems, such as fire-resistant cladding and cooling systems, to protect structural elements from extreme temperatures.
Design Implications:
Structures designed according to the RWS curve must be able to withstand prolonged exposure to high temperatures, which requires advanced materials and construction techniques.
The curve is particularly relevant for tunnels that are expected to experience high-risk fire scenarios, such as those involving large vehicles or hazardous materials.
Comparison with Other Tunnel Fire Curves:
Compared to other design fire curves like the ISO 834 or hydrocarbon curves, the RWS curve represents a more severe fire scenario with a higher temperature and longer exposure duration. This makes it suitable for situations where the risk of intense fires is greater.
The RWS fire curve is a critical tool in tunnel fire safety design, providing a rigorous standard for assessing how tunnel structures perform under extreme fire conditions. By simulating the effects of a major tanker fire, the RWS curve helps ensure that tunnels can withstand high temperatures for extended periods, thereby enhancing safety for both tunnel users and emergency responders.
CETU Guideline: N0, N1, N2, N3
In France, fire protection in road tunnels is governed by the CETU guidelines, which classify tunnels into four categories—N0, N1, N2, and N3—based on their size and importance. Each category represents a specific combination of time-temperature curves:
- N0: No specific fire protection requirements.
- N1: Requires compliance with the HCM curve for 60 minutes and the ISO curve for 120 minutes.
- N2: Demands adherence to the HCM curve for 120 minutes.
- N3: The most stringent, requiring the HCM curve for 120 minutes and the ISO curve for 240 minutes.
These categories ensure that tunnel design and construction account for varying levels of fire risk, depending on the tunnel’s usage and importance.
In conclusion, time-temperature curves are a critical aspect of fire engineering, providing the necessary framework to ensure that tunnels are designed with safety in mind. These curves help define the materials, construction techniques, and safety measures required to protect tunnels from the devastating effects of fire, ensuring both structural integrity and the safety of occupants.
FAQ
Design fire curves for tunnels are critical tools used in fire safety engineering to model the behavior of fires in tunnel environments. These curves provide a standard way to simulate the temperature and intensity of a fire over time, helping engineers design tunnels to withstand high temperatures and ensure safety during fire incidents.
The Rijkswaterstaat (RWS) fire curve is a design tunnel fire curve used primarily in the Netherlands for evaluating the fire resistance of road tunnels. It is named after the Dutch Ministry of Transport, Public Works and Water Management, Rijkswaterstaat, which developed the curve.
The RWS curve simulates a fire reaching a maximum temperature of approximately 1350°C (2462°F).
Compared to other design fire curves like the ISO 834 or hydrocarbon curves, the RWS curve represents a more severe fire scenario with a higher temperature and longer exposure duration. This makes it suitable for situations where the risk of intense fires is greater.
Tunnel fire curves, also known as fire temperature-time curves, are used in fire safety engineering to model the temperature and intensity of tunnel fires over time. Different curves are used to represent various fire scenarios and conditions based on the type of building or infrastructure. These are ISO 834, RWS, HC, MHC, RABT, EBA.


5 Comments
ISO curve - ISO 834 time-temperature fire curve · 27 August 2024 at 2:40 pm
[…] one of the many time-temperature fire curves which are also used in designing fire protection in […]
Passive Fire Protection in Tunnels - an introduction · 27 August 2024 at 3:37 pm
[…] There’s more information about the design fire curves for tunnels here. […]
How to select the right fire board for tunnels - Tunnel Passive Fire protection - fire boards and fire cladding · 27 August 2024 at 3:39 pm
[…] Thickness of the tunnel fire board depends on several factors. The main driving factor should always be the evidence from actual fire test. The fire board thickness will depend on the fire test duration and conditions under which it was tested, like the fire curve used for the tunnel design and fire test. […]
Concrete Spalling in Tunnel Fires: Causes, Effects, and Prevention · 29 November 2024 at 11:06 am
[…] Key Fire Curves in Tunnel Design: […]
RWS fire curve - Tunnel Passive Fire protection - fire boards and fire cladding · 12 November 2025 at 7:36 pm
[…] Comparison to Other Tunnel Fire Curves […]